
What Are Excel Power Query and Power Pivot?
Power Query is a business intelligence tool available in Microsoft Excel and Power BI that allows users to import data from many different sources and then clean, transform and reshape their data as needed.
Power Pivot allows users to perform powerful data analysis and create sophisticated data models. With Power Pivot, you can mash up large volumes of data from various sources, perform information analysis rapidly, and share insights easily.
Six Reasons a NetSuite User Would Use Power Query
There are multiple reasons for choosing Excel Power Query and Power Pivot. Here are just a few.
- Need to link multiple data sources (or NetSuite saved searches) together
Power Query enables you to build a data model directly in Excel that relates each of your data sets, whether they be NetSuite saved searches, data from the web, SQL, etc. - Data needs to be transformed and cleansed on a repeated basis
When using Power Query to access and transform data, you define a repeatable process (query) that can be easily refreshed in the future to get up-to-date data.
In the event that you need to modify the process or query to account for underlying data or schema changes the Power Query Editor makes this easy.
The following illustration shows a few of the transformations available in the Power Query Editor.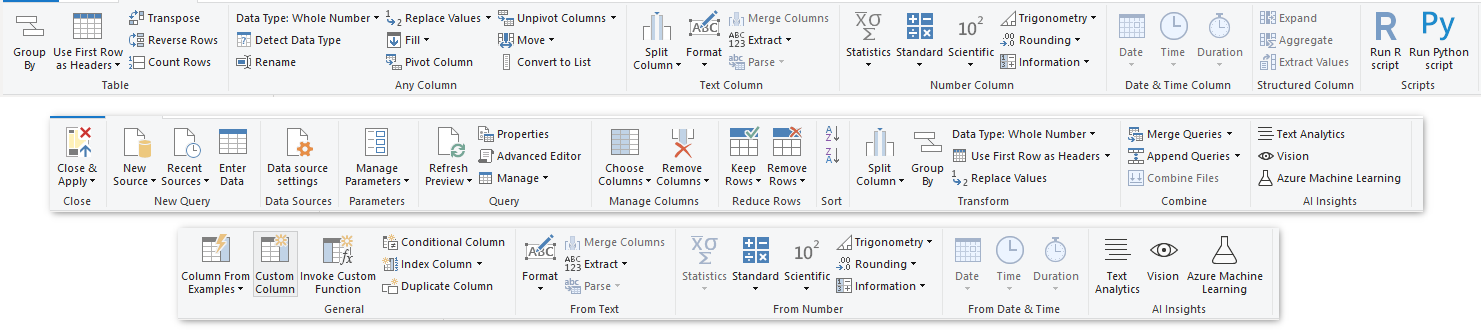
- Your Excel file has all the data your users need to analyze, but you need to share it without risking data loss and integrity.
With Excel Power Query your users can ‘connect’ to your data and perform their own analysis without actually editing the original file thereby eliminating any possibility of an end user damaging your data. - Your original data source comes from an App like NetSuite and you need to add custom columns or measures and prevent them from being overwritten during a ExtendInsights refresh.
Because Power Query transformations occur outside of your original data any custom columns or measures you add will remain even when your original data source is refreshed and an Excel table is re-created by ExtendInsights. - You need to work with large data sets that Excel cannot handle.
Power Pivot allows you to go beyond the limitations of a native Excel file (i.e., you can have greater than 1 million rows). - You need to combine multiple files together.
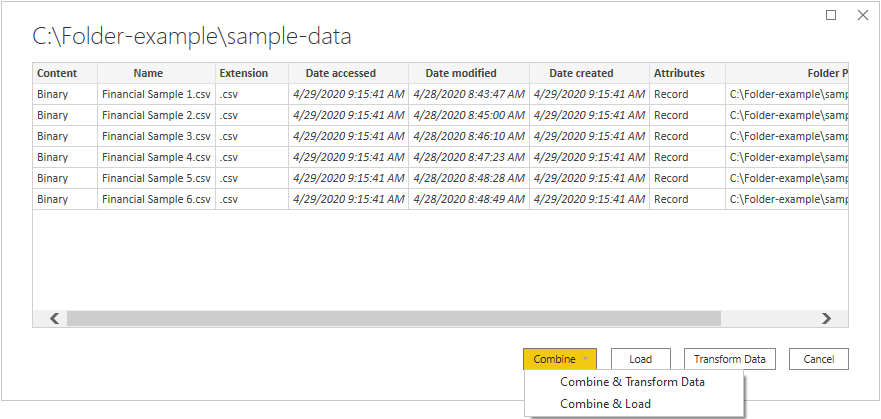
Power Query includes a folder connector that allows you to import existing and, importantly, newly added files to your existing data model. This is known as “Combine & Load To.” As an example, your organization may add a new Excel file with financial data for each month. If you’re using NetSuite you could use ExtendInsights to target a specific monthly folder and update it on a schedule. Whenever the file gets updated Power Query will update your data model and you will see the results of all the combined monthly files aggregated in one view. This is a great example of how it’s possible to support more than 1 million rows of data. The following illustration shows a step in the folder connector that enables users to automatically create connections to new files in the folder that meet user defined criteria.
Getting Your NetSuite Data into Excel
NetSuite has a powerful search engine that can help you extract the data you need. Historically users have had to save their results as a CSV file and then copy and paste into Excel. This might be acceptable for a one off analysis, but it’s certainly not scalable. Further, if you want to relate multiple search results together you’re left with a number of VLOOKUP formulas and might even resort to VBA.
Using ExtendInsights and Power Query Together
At CloudExtend, we have a laser focus on making our customers’ lives easier. Our newest app, ExtendInsights for NetSuite, is already helping our customers visualize and analyze their NetSuite data in Excel and Power BI faster than the competition and at a fraction of the cost.
“I’ve been waiting 10 years for an app that can consolidate my NetSuite searches in Excel so I could stop using CSV export and copy/paste. CloudExtend nailed it.”
–Evan Vana, Chief Operating Officer, New England Clean Energy
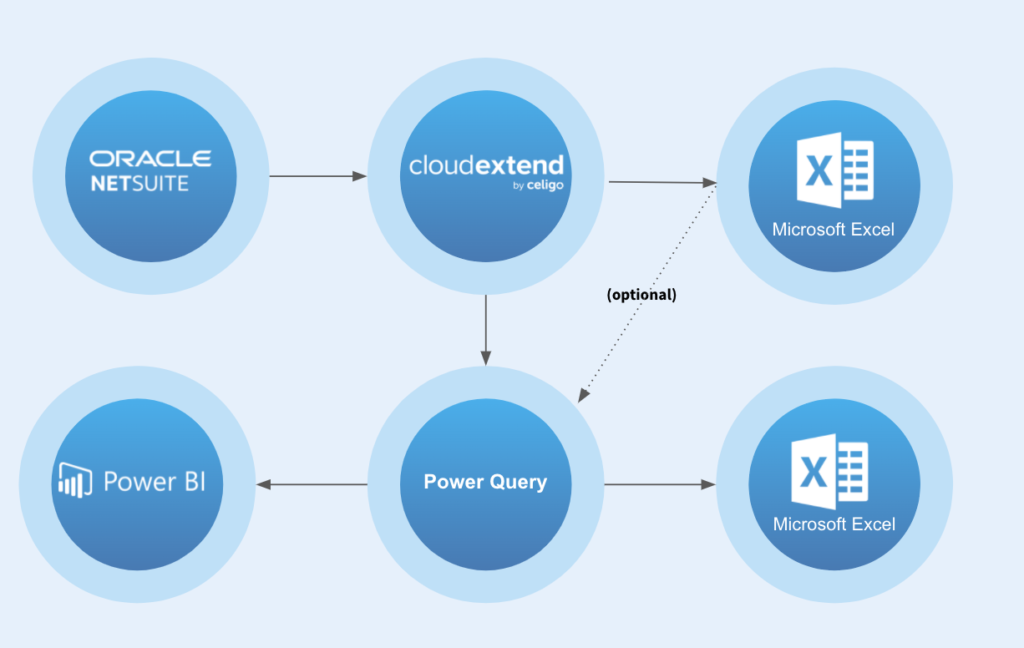
ExtendInsights for NetSuite bridges the gap between NetSuite and Excel allowing users to see their NetSuite data in their spreadsheet. Users can then choose to analyze their data directly in Excel or use Power Query to build a relational data model, consolidate, and transform their data for a more sophisticated analysis in Excel or Power BI.
Define and Structure Your NetSuite Saved Search
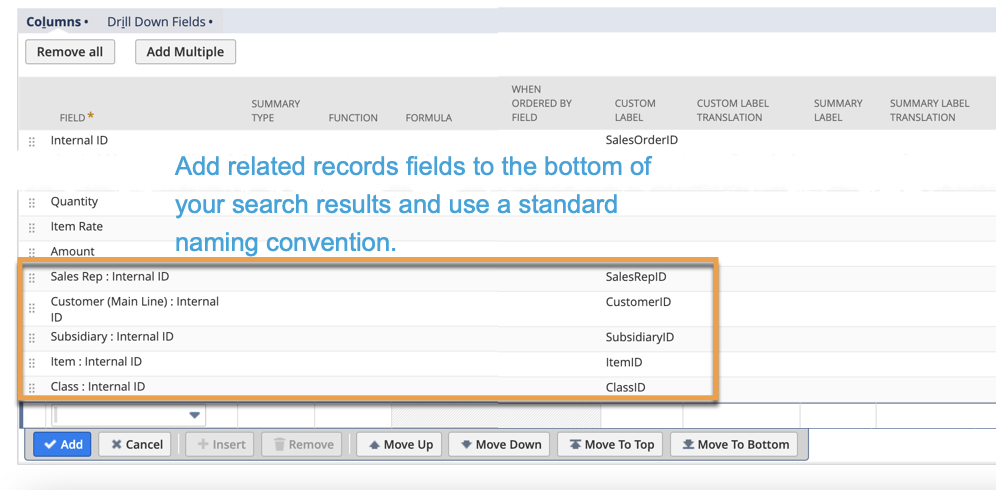
The first step in analyzing your data is to structure your saved searches so that the results will have common key fields that can later be used to link them together. You’ll want to include dimension data and fact data. Dimension data is typically on the “one” side of a one to many relationship and fact data is on the many side. A typical NetSuite dimension table would be a customer or employee record and a fact table would be transaction records, such as sales.
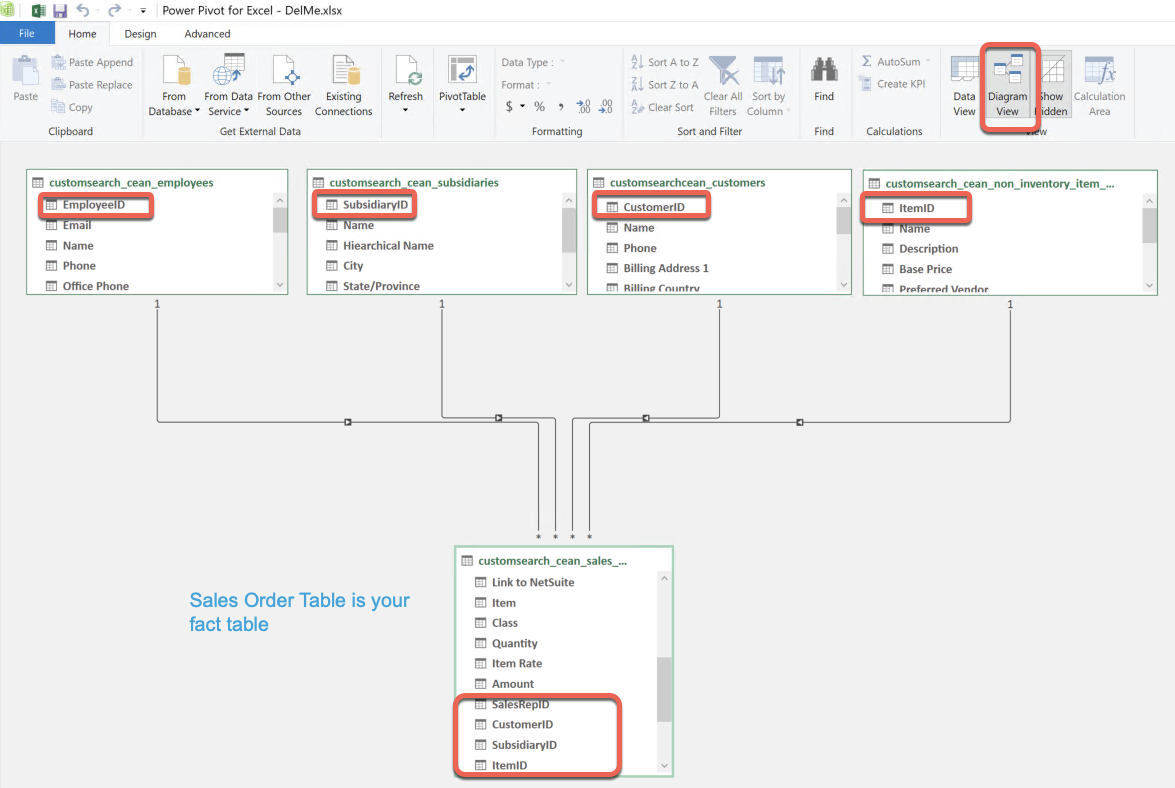
The common key field across tables will typically be a NetSuite internal ID field. We recommend that you add the key field in your dimension table at the top of the search results and that your fact tables have the key fields at the bottom of the search results and that you use a standard naming convention. An example is in the screenshot below.
Add your searches to Excel using CloudExtend and assign them to a schedule
The next step is to bring your NetSuite searches into Excel. This Excel file will be used as the source for Power Query. Typically end users will not be editing this file and instead they will be accessing it via Power Query. This is also an ideal way to share your data with co-workers in a way that preserves the integrity of your file.
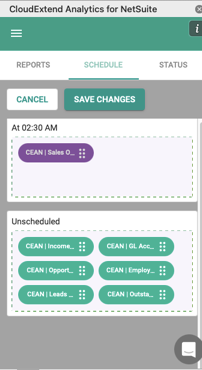
Here you can see the scheduling tab in ExtendInsights. Once you’ve connected your saved searches to Excel you can assign them to run at scheduled times. CloudExtend can update your workbooks in the background even when they are closed. As a best practice we recommend one search for each schedule. Each workbook can have multiple schedules so if you have 5 searches you could have 5 different schedules.
Use Power Query ‘Get Data’ to connect to your Excel source file
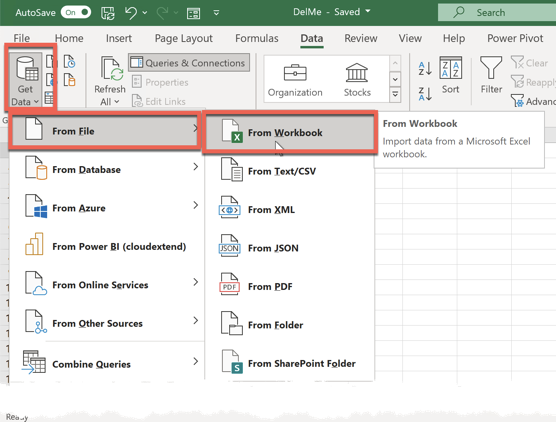
Power Query can connect to multiple data sources, Excel being just one of them. Since all the data we need for analysis now lives in the Excel file we created and is updated on a scheduled basis we’ll want to connect to that file. Open a new workbook and then use Excel’s ‘Get Data’ function to connect to the Excel source file that you created previously.
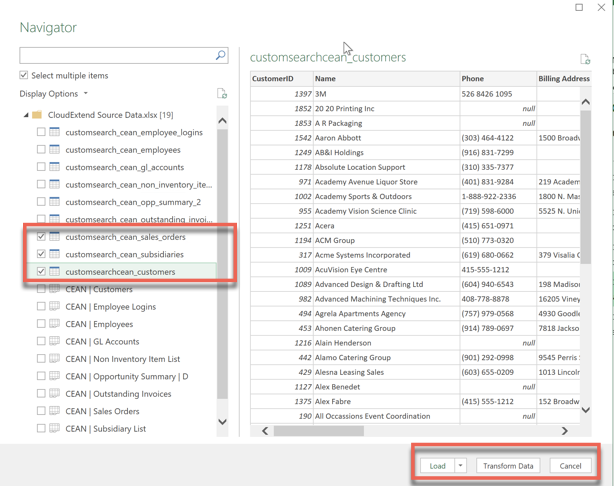
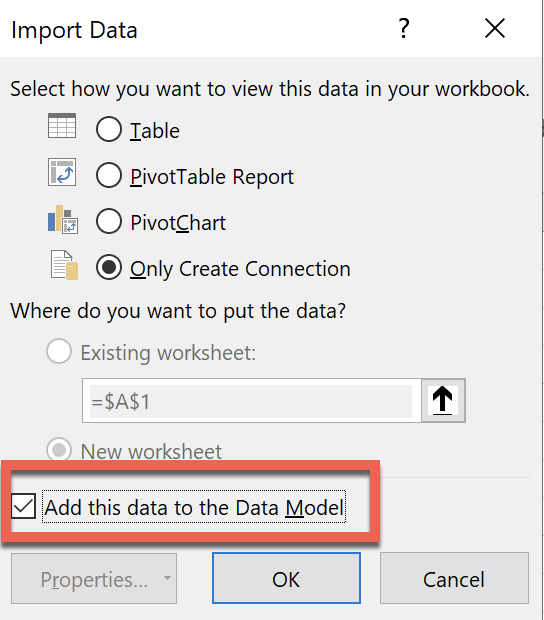
When you select the workbook you will see a list of tables in the workbook as well as a list of all the worksheets in the workbook. We recommend that you select the tables if you’re working with CloudExtend as it will automatically already have the first row set as headers. Once you’ve selected the tables we recommend choosing ‘Transform Data’. This will give you an opportunity to remove unnecessary columns, add new calculated columns, and perform any data cleansing. The beauty of this is that the steps will be remembered each time the data is refreshed. If you forgot something you can always open the Query Editor in Excel and modify your steps. To complete the import you’ll want to be sure that you close and load to the data model.
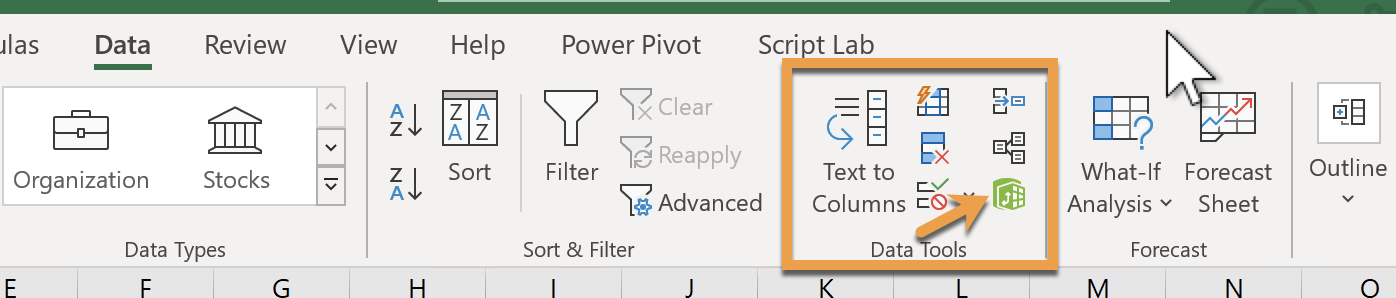
Now you’ll want to edit the data model by navigating to the data tab in Excel. Under the Data Tools section you’ll see an icon to launch the Power Pivot window.
In the power pivot window you will connect your dimension tables (Customer, Subsidiary, Employee, Subsidiary below) to your fact table (Sales Orders) by dragging and dropping a connecting line between the tables.
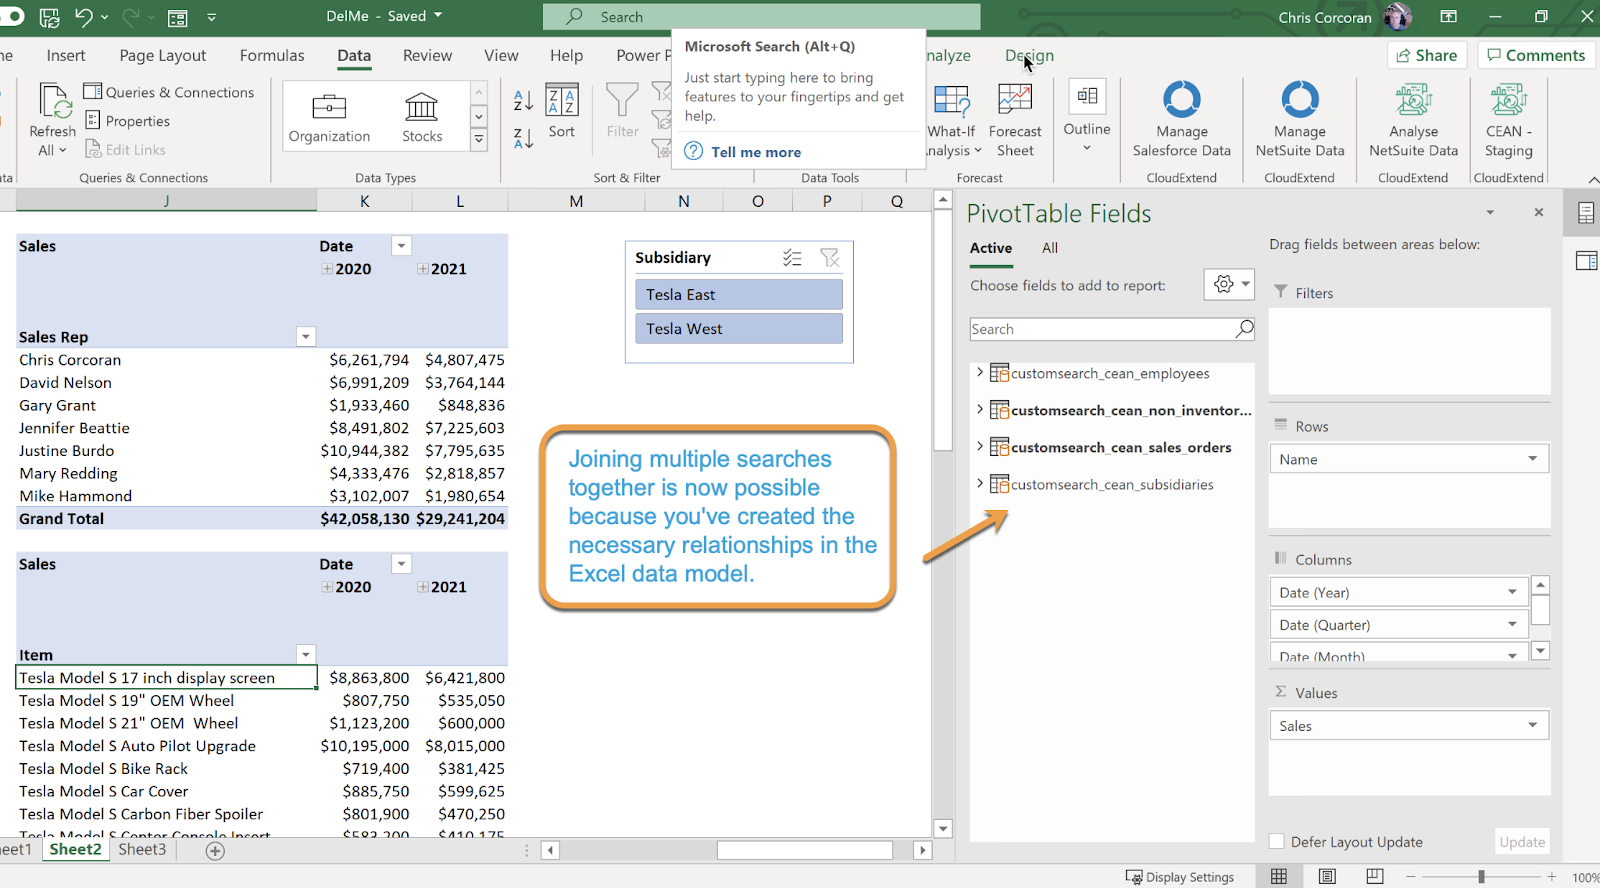
Now that you’ve related all your tables together you can slice and dice by any dimension. Below you can see sales by rep as well as sales by item. A slicer has been added that allows users to limit the data to a specific subsidiary. Unlike a web based UI, your analysis is updated instantly as you can leverage the speed and power of Excel.
A Note on Power BI
Microsoft Power BI also uses Power Query. To connect to Power BI the steps are similar.
- Create your data source (in our case Excel) and use CloudExtend to populate it with scheduled saved searches from NetSuite
- Open Power BI and use Power Query and select the Excel file as your source data.
- Associate the tables by common key fields
- Analyze away!
The Bottom Line
Excel continues to be a valuable tool for visualizing and analyzing data. ExtendInsights helps users bridge the gap between Netsuite and Excel. With Power Query they can take this a step further and build relational data models in Excel that connect multiple NetSuite saved searches together all in one platform, whether it be Excel or Power BI.
Other Resources
Leila Gharani “How Power Query will change the way you use Excel.”
Mynda Treacy “Combining multiple files containing multiple sheets with Power Query.”