
For many companies, pain points during the sales cycle cannot be pinpointed to a single issue. There are multiple challenges, from tedious processes for getting important information into NetSuite or not having sales data accessible to track the pipeline. Much of this centers around not having sufficient visibility and reporting, which leads to difficulty creating accurate sales dashboards from NetSuite data.
Better Sales Dashboards Start with Communication and Visibility into the Sales Cycle
A typical sales cycle starts with prospecting leads, qualification, initial contact made, addressing objections, and then finally, presenting an offer, (hopefully) closing the deal, and providing referrals. If NetSuite is the central source of truth and information, getting information to NetSuite for visibility to everyone is critical. During a sales cycle, there are typically many people involved. Starting from the sales team to SDRs, marketing, solution consultants, and even IT. For everyone on the selling team to be aware that, for example, a solution consultant met with a prospect and was able to get an application installed, the information would need to be in the NetSuite CRM. It would not be ideal to require monitoring the solution consultant’s calendar to see if that customer was booked.
Unfortunately, getting that information to NetSuite can be a manual, time-consuming process, so often users will say they will get to it “later” or they just do not do it at all. The organizational mantra should be “if it isn’t in NetSuite, it didn’t happen.” But to accomplish that, every user in an organization should have access to data, including sales data, without having to jump through any hoops. This ultimately impacts what ends up in the pipeline and subsequently the sales dashboard.
Individual reps who want to look at their numbers daily should be able to track progress toward their sales quota on a dashboard. Everyone should be able to see company metrics, including revenue. And, right down to the specific product line, customer success managers should see their churn or customer cancellations by product, by customer, by date, and even more. Even projects like understanding churn, the ideal customer profile, or learning more about the types of industries that buy from the business shouldn’t be rocket science.
What Does A Sales Dashboard Consist of?
So, how can this be achieved? First, let’s discuss what a dashboard created from NetSuite data may consist of:
Monthly/Quarterly/Annual Sales – This can compare quarters, months, and years to each other or reps to quota. It can also be broken down by new business versus customers and renewals.
Opportunities – Sales reps, managers, and other teams need to see opportunities, both closed and open to understand where they are in comparison to goals.
Pipeline – Pipeline is another key performance indicator (KPI) for whether the business will reach its sales targets. This data can be sliced by rep, region, and closed versus quota.
These are common examples, but a sales dashboard built from NetSuite data can contain different metrics and can also be customizable for individual users. The ultimate goal is to be a one-stop visual representation of how the business is trending toward goals.
Why is A Sales Dashboard Important?
Sales dashboards are a mechanism to consistently monitor the health of the business. Key indicators, such as pipeline, churn, and meeting sales targets can help identify early if challenges are ahead. By monitoring trends, sales dashboards can also help close deals at a higher velocity, which can dramatically change the future trajectory.
Sales dashboards can also help teams feel connected with their results. If team members are provided visibility into company-wide metrics, they better understand the source of truth the company is utilizing. Having one source of truth also helps set forecasts based on trusted data.
How to Build A Sales Dashboard
There are many options available for building sales dashboards, but Excel is an ideal choice. One reason for that is simply access to the program, there are millions of users worldwide. Another is its power to turn simple formulas into sophisticated visualizations, and finally, its familiarity and comfort. Users are not required to have advanced knowledge of Excel to build interactive dashboards.
Historically once a user had built an amazing dashboard the only way to keep it up to date was by manually exporting data from their source (such as NetSuite) and then copying and pasting it into Excel and refreshing all the data. ExtendInsights allows users to build a dashboard once and with a single click they can refresh their entire data set at once (or even put the entire dashboard on a schedule).
To start building a sales dashboard with interactive buttons that can analyze sales data by year, sales rep, customer, and item class:
Build your NetSuite saved search
Create a saved search based on Sales Orders and use the example below as a rough guide to start.
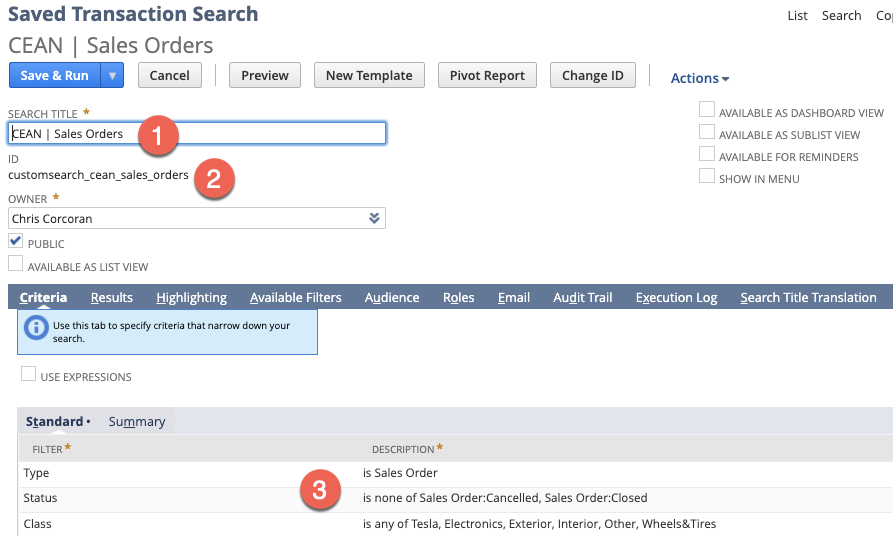
- You can give your search any name. We recommend CEAN | Sales Orders
Note that CEAN is short for CloudExtend Excel Analytics. The workbook that holds the results will automatically add a worksheet with the same name as the search - Give the search ID a name of _cean_sales_orders (note after you save your search NetSuite will prepend it with customsearch.
- Add your own criteria
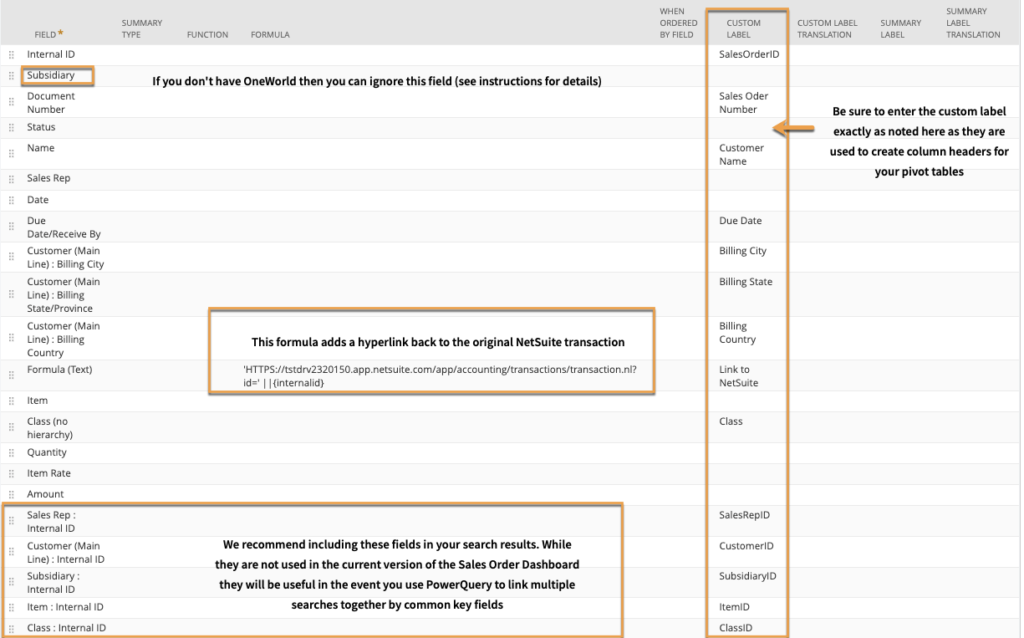
Results columns
Below are some recommendations for fields you may want to include in the results of your search. Note that in this saved search we’re sending over data from the joined tables such as Customer Name, Subsidiary, etc. as one flat file. If you plan to use more advanced analytics and wish to create relationships between tables using a data model then you should add the internal ID’s of these fields in this search and also create separate searches to bring in each related table (ie Class, Customer, Subsidiary).
Bring your saved search to Excel
After you’ve saved your search, it’s time to open Excel and bring that saved search in with CloudExtend. If you’re using our pre-built dashboard this will be your final step.
- Open CloudExtend
- Add the saved search you created (CEAN | Sales Orders)
- Once the search is loaded it will run for you (after you click ‘Create’)
- We’d recommend skipping adding it to a schedule until you’ve got your dashboard nailed down.
- Create pivot tables for each set of data you want to analyze. End users won’t see these, but they will be used to make up charts on your dashboard. For example, if you want to see Sales By Rep By Month, create a pivot table that gives you that info.
- Create charts based off your pivot tables.
- Create a blank worksheet to hold your dashboard and remove all the gridlines. Copy the desired charts that will make up your dashboard and add them to the blank dashboard worksheet.
- Add slicers such as date, sale rep, product, class, etc., so you can easily slice and dice your views.
- Once your dashboard is configured to your liking consider setting your searches on a schedule or click ‘Refresh All’ to update your searches.
Try CloudExtend for Free
Helping to make building sales dashboards significantly easier and faster is just one of the many capabilities of CloudExtend Excel Analytics that makes our users’ lives easier every day.
Learn how Botanical Sciences, Inc. used CloudExtend to make better informed decisions with real-time data, and have company-wide visibility into customer communications that increased productivity by 30%.
Learn how MIND Research significantly improved the accuracy of the sales team’s forecasting and reduced IT support cases previously needed to produce them by 50%.
Click here to try CloudExtend Excel Analytics for free..