
Marketing teams on HubSpot usually know how much they are spending per channel. What is often harder to answer quickly is which channels are actually driving revenue, and whether the revenue correlation is supported when you look at it from more than one angle. Without attribution, budget conversations tend to fall back on whichever channel is loudest, the one with the most leads, the most recent campaign, or the most familiar name, rather than the one closing deals. This is how marketing spend can silently drift towards channels that feel productive rather than ones that are proven to be. It’s also how marketing ends up defending a budget line item with a gut feeling instead of an actual number, which is a difficult position to hold in front of finance or leadership and can ultimately lead to distrust.
Attribution is what turns “we ran a lot of campaigns this quarter” into “this channel returned $4 for every dollar spent, and that one only returned $0.80.” It connects the deals already sitting in HubSpot back to the channels that sourced them, so spend decisions can be made on evidence rather than instinct. The catch is that attribution is not just one number. First-touch, last-touch, and multi-touch models can each tell a different story about the same channel, and picking just one model, or building the comparison by hand, is exactly the kind of project that marketing teams tend to put off.
This blog walks through how to build a channel attribution and ROI report directly from your HubSpot data, using a free, ready-made attribution and ROI dashboard template so none of it has to be built by hand.
Why we Built a HubSpot Attribution Dashboard without Power Query or Custom Properties
Without a template like this, marketing teams are often forced to choose between two expensive options. One is buying into attribution built for a much bigger budget: HubSpot’s own multi-touch attribution reporting lives behind the Marketing Hub’s Enterprise tier, and dedicated attribution platforms built for enterprise marketing orgs come with substantial pricing and setup, often including onboarding, licensing per user, and a RevOps or marketing ops team to configure and maintain them.
The other option is building it entirely from scratch: pulling HubSpot data into a spreadsheet, most often through ExtendInsights, then hand-writing every formula that turns raw data into revenue-by-channel and ROI numbers, and maintaining that model yourself going forward.
This template is built to live between those two options. It provides the same channel-level attribution and ROI numbers the enterprise tools produce, without the enterprise price tag or a licensing tier upgrade, and without the open-ended build project of modeling it yourself from zero. Two specific problems tend to come up on that DIY path, and this template is built to skip both of them.
The first is a data problem. HubSpot does not have a native “Touchpoints” object, so without a tool like this, getting a true multi-touch model with a full journey and touchpoint-count breakdown usually means creating custom properties in HubSpot to log every touchpoint.
This template skips that step entirely. HubSpot already tracks first-touch and last-touch as native Contact fields (Original Source and Latest Source), and ExtendInsights pulls those straight onto the Deal row, the same way it pulls Contact email. That’s enough for first-touch, last-touch, and a position-based blend with no custom properties required.
It also skips Power Query, which most HubSpot dashboard templates rely on and which has long been unreliable in Excel for Mac. This one runs on plain formulas, so it behaves the same way on Windows and Mac.
And, because it runs on formulas rather than model calls, the cost stays fixed no matter how much data you pull, and the same inputs always produce the same numbers. That’s not a substitute for AI-based analysis; it’s what a good input to one looks like: you can still point to an AI tool at the output to summarize trends, flag anomalies, or dig into why a channel moved, and trust that the numbers won’t shift between refreshes.
What’s Included in the HubSpot Attribution & ROI Dashboard Template
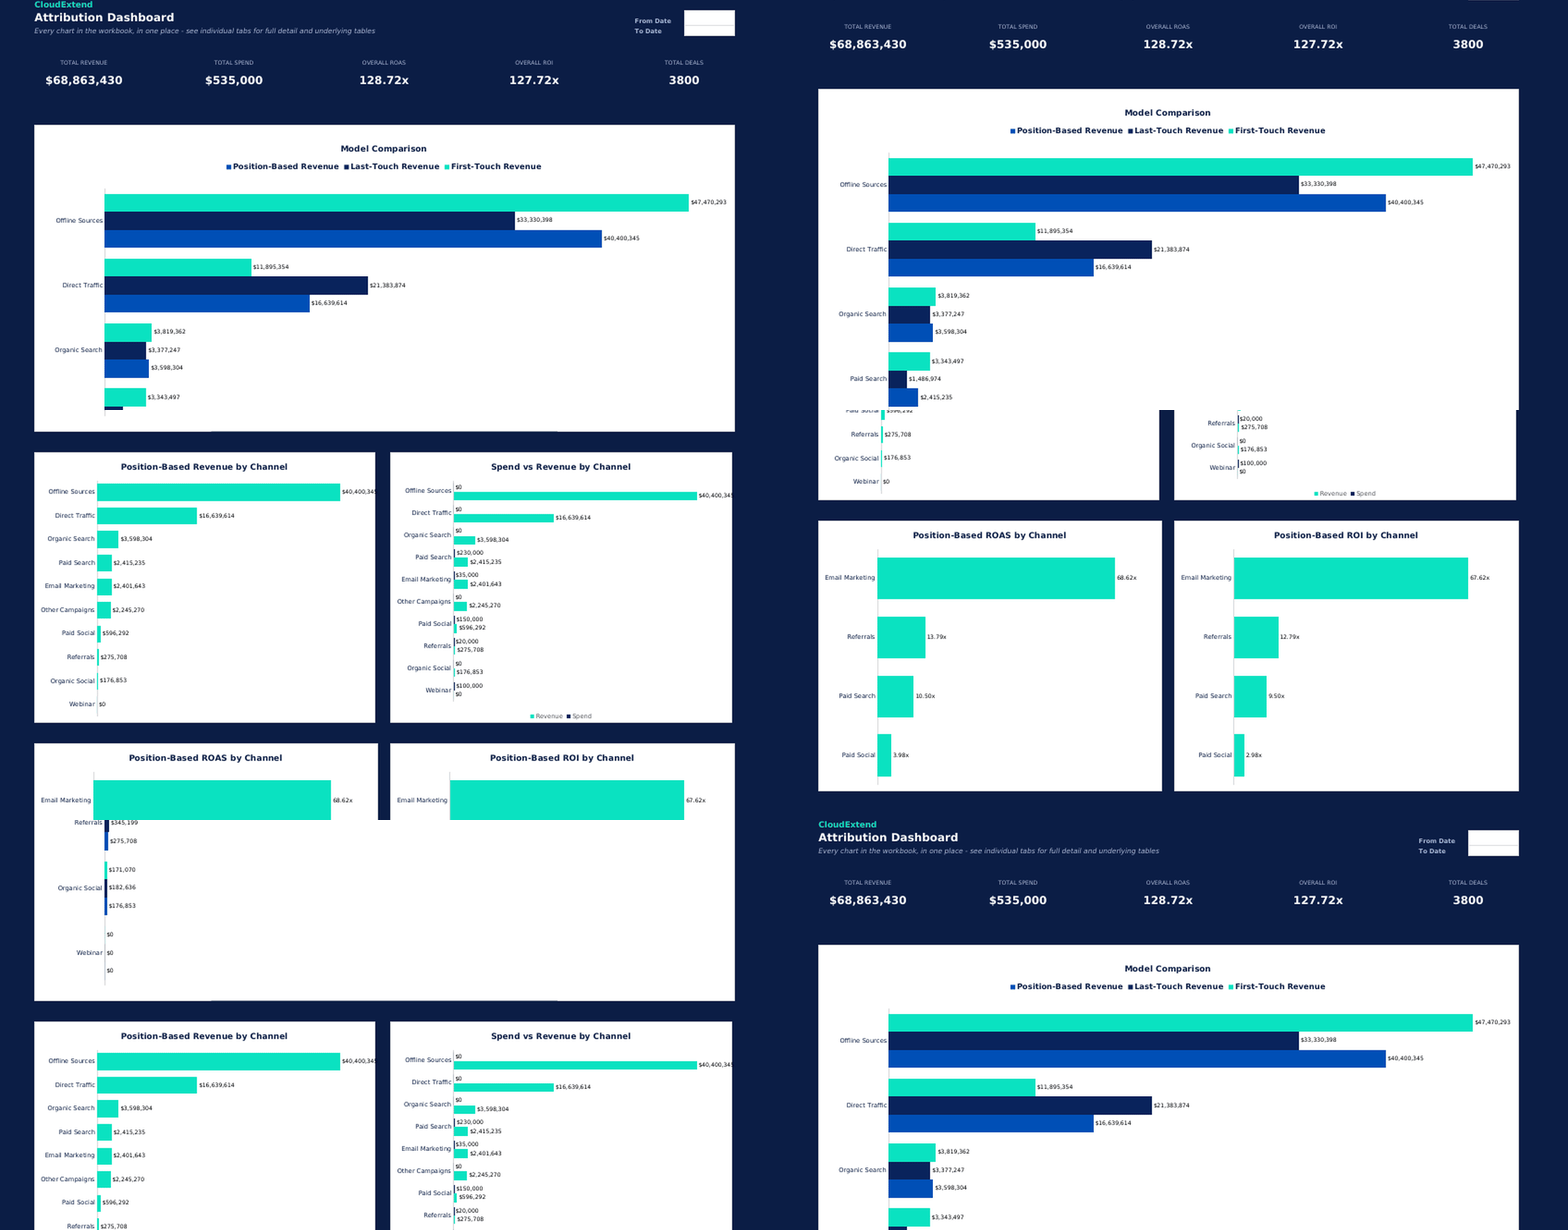
- Total revenue, total spend, overall ROAs, and total deal count: rolled up and filterable by date range
- Revenue by channel under three attribution models: first-touch, last-touch, and a position-based blend of the two, so you can see how the story changes depending on which model you trust
- ROI and ROAs per channel: so you can compare channels on efficiency, not just total revenue
- Spend vs. Revenue efficiency: mapped side by side per channel
Benefits of a HubSpot Attribution & ROI Dashboard for Marketing Teams
For marketing teams, this dashboard turns a question that usually requires a request to an analyst, or a custom BI build, into something anyone on the team can run themselves in the same afternoon that they pull the data:
- See past single-model bias: First-touch and last-touch attribution can tell very different stories about the same channel. Having both models plus a blended view side by side means budget decisions aren’t riding on whichever model happens to be turned on.
- Tie spend to outcomes, not just activity: ROI and ROAs per channel move the conversation from “how many leads did this channel generate” to “did this channel pay for itself.”
- Work with data that you already have: No dependency on RevOps or admins to build custom properties before marketing can get answers.
- Trust it across the whole team’s devices: No Power Query means no “it works on my machine” problem between Windows and Mac users on the same team.
- Reuse it every reporting cycle: Because the workbook is formula-driven rather than hardcoded, refreshing it for a new month or quarter is a re-pull and a spend update, not a rebuild.
- Pair it with AI tools instead of choosing between them: Fixed ExtendInsights pricing means the cost doesn’t creep up as usage grows, and formula-based results are the same every time from the same data, so it’s the dependable numbers layer teams can trust before handling anything to an AI tool for further analysis or summarization.
If your team is still guessing which channels are actually paying off, this is a place to start. Download the HubSpot Attribution & ROI Dashboard Template and connect it to your own data today.
FAQ
HubSpot attribution & ROI dashboard
Just the Deal object with Deal Name, Amount, Close Date, Original Source, and Latest Source included in the field selection. No custom properties and no separate Contacts pull are required.
Yes. It’s built entirely on plain formulas reading from an ExtendInsights pull tab, with no Power Query, macros, or external connections, so it behaves the same on Mac and Windows.
First-touch, last-touch, and a position-based model that blends the two. All three are shown side by side on the Attribution Dashboard tab so you can compare them directly.
Enter it directly on the Campaign Spend tab. Ad spend isn’t a HubSpot object, so there’s no way to pull it automatically. This is the only manual input the dashboard requires.
Up to 10,000 rows out of the box, matching HubSpot’s own per-download API cap. If you need more, copy the last formula row in the Attribution Engine tab and paste it down as far as you need.
Add a row on the Channel Mapping tab pairing your raw label to a normalized channel name. Anything left unmapped falls back to “Uncategorized” instead of breaking a formula.
Yes. It’s a free, downloadable ExtendInsights template with no cost to use.
No. This dashboard is built to be used alongside AI tools, not instead of them. Because it runs on ExtendInsights’ plain formulas rather than model calls, pricing stays fixed regardless of how much data you pull or how often you refresh, and the same inputs always produce the same numbers. That makes it a stable, verifiable foundation you can layer AI-based summarization or analysis on top of, with confidence in the figures underneath.