
HubSpot’s contact and lead views are good at counting. They’ll tell you how many contacts came in this month, how many are sitting in each lifecycle stage, and which sources sent them. What they’re less good at is showing all of these things together in one filterable view, broken down by status, ranked by source contribution, and tied back to how long it actually takes those leads to close.
The result is that lead reporting often gets done in pieces. Someone exports contacts for the date range, someone else builds a pivot, the source breakdown lives in one tab, and the status breakdown in another, and by the time the numbers come together for a meeting, they’re already slightly out of date. If your team runs this process more than once a month, you’ve probably rebuilt at least part of it every time.
This post walks through a free HubSpot inbound leads dashboard template for Excel that consolidates all of it in one place: lead volume and rate, status breakdown, source analysis, lifecycle stage mix, average days to close, and the date and status filters. All of these are computed automatically from a single HubSpot Contacts data pull via ExtendInsights.
Why Does Inbound Lead Reporting Feel Harder Than It Should?
The core problem is not data access; HubSpot has the data. The problem is that the questions that marketing and sales leadership need to answer span across several properties and records at once.
“Which sources are driving our best leads?” requires combining Original Source with Lifecycle Stage and Status, not just counting form submissions per channel. “Are we converting leads fast enough?” requires knowledge of average days to close, filtered to the leads that actually progressed. “Is lead quality improving or just volume?” requires seeing lead rate, contacts converting to leads, and how it trends over time, not just a raw count this month.
HubSpot’s native dashboards answer parts of these questions well. But combining all of them, with a date filter and a status filter that work together across every chart, usually requires either a custom BI build, a Marketing Hub tier upgrade, or a lot of manual spreadsheet work.
This template is built to skip all three.
Why We Built This Without Power Query or Custom Properties
Two specific problems tend to come up when marketing teams try to build this kind of view themselves, and this template is built to avoid both.
The first is a compatibility problem. Most HubSpot dashboard templates built in Excel rely on Power Query, Excel’s “Get & Transform” data connector, in order to reshape the data. Power Query works well on Windows, but its support in Excel for Mac has been limited, which means dashboards built on it simply don’t work for half of the team. This template runs entirely on plain formulas reading from an ExtendInsights pull tab. No Power Query, no macros, no external connections. It behaves the same on Mac and Windows.
The second is a setup problem. Some lead reporting templates require you to create custom properties in HubSpot before the template will work correctly, so that the data has the shape the template expects. This one does not. It only uses standard HubSpot contact fields, the ones already on every record by default. So, there is nothing to configure in HubSpot before you start.
The required fields are: First Name, Last Name, Company Name, Lead Status, Lifecycle Stage, Close Date, Create Date, Original Source, and Latest Traffic Source. All fields are standard; no admin work needed.
What’s Inside the HubSpot Inbound Leads Dashboard Template?
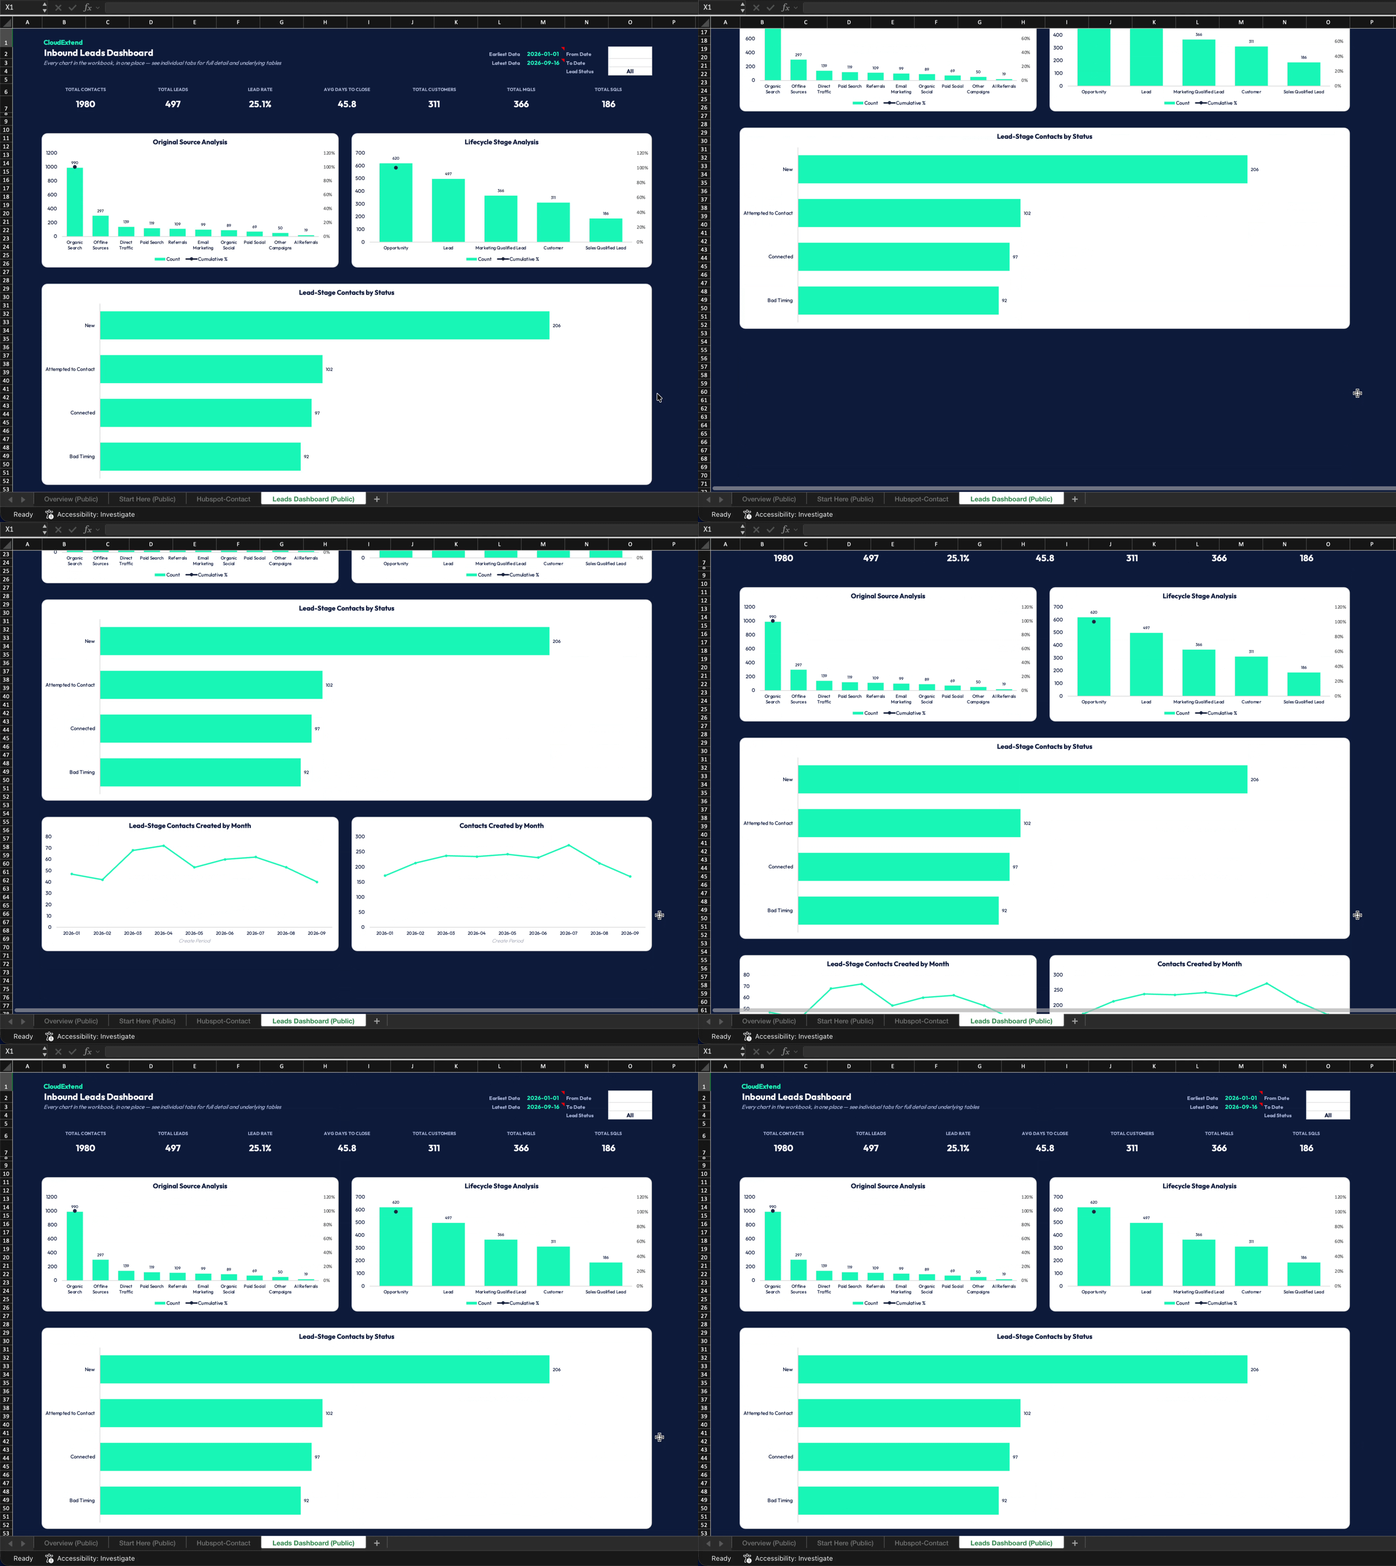
The dashboard is organized around six KPI cards at the top and four charts below, all responsive to the date range and the Lead Status filter.
| Metric | What It Shows | Why It Matters |
| Total Contacts | All contacts in the filtered date range | Baseline volume to compare against everything else |
| Total Leads | Contacts at the Lead lifecycle stage | The funnel entry point: volume in the pipeline |
| Lead Rate | Leads ÷ Total Contacts | Whether contact-to-lead conversion is improving or just keeping pace with volume |
| Avg Days to Close | Average time from contact creation to close date | Helps forecast and spot shifts in lead quality or sales velocity |
| Total Customers | Closed contacts in the filtered period | The outcome metric: what the funnel actually produced |
| Total MQLs/SQLs | Marketing and sales qualified lead counts | Pipeline health check: are leads qualifying through or stalling? |
Below the KPI cards, four charts give you the full picture:
Lead-Stage Contacts by Status: a bar chart of how many contacts are sitting in each Lead Status (New, Attempted to Contact, Connected, In Progress, Bad Timing, Open Deal). This is the chart that spots bottlenecks: a large “Attempted to Contact” bar relative to “Connected” can signal a timing or messaging gap in outreach.
Lead-Stage Contacts Created by Month: trend over time for new lead-stage contacts, so you can see whether inbound volume is growing, flat, or seasonal.
Original Source Analysis (Pareto): a ranked chart of which sources are sending the most contacts, with a cumulative percentage line. The Pareto view makes it immediately clear which two or three sources are driving 80% of your volume, and which ones are contributing very little.
Lifecycle Stage Analysis (Pareto): The same approach is applied to lifecycle stages, so you can see where contacts are concentrating across Lead, MQL, SQL, Opportunity, and Customer, as well as where the funnel is thinning.
The filters, date range (from/to), and a Lead Status dropdown apply across all charts and KPI cards at once. New statuses in your data appear in the dropdown automatically; you don’t have to maintain a list.
Download the free HubSpot Inbound Leads Dashboard Template
How Do You Set Up the HubSpot Inbound Leads Dashboard?
Setup is a single step: pull your HubSpot Contacts into the HubSpot-Contact tab using ExtendInsights, include the standard fields listed above, and every other tab in the workbook computes automatically.
The computation engine is pre-built for 5,000 rows and looks up columns by header name rather than fixed position, so it handles the query-info row that ExtendInsights sometimes adds above the column headers, and it isn’t sensitive to the column order in your download.
If your HubSpot account has more than 10,000 contacts, download without a filter in ExtendInsights (the HubSpot API caps filtered downloads at 10,000 records), then use the dashboard’s own filters to narrow the view.
Two supporting tabs, Leads Calcs and Metrics, are hidden by default to keep the tab bar clean. They’re the computation engine and the chart-source tables that feed every KPI and chart on the dashboard. They’re fully live; you can unhide them at any time by right-clicking any tab and selecting unhide.
What Can You Learn From This Dashboard That HubSpot’s Native Reports Don’t Show?
This template provides a straightforward way to combine multiple HubSpot properties. HubSpot can show you lead count by source; it can show you lifecycle stage distribution; and it can show you contact timeline. What it cannot do easily is show how all of these work together, filtered by date and status, in a view that you can share outside HubSpot. Whether it be leadership, an agency, or a sales partner, it can be shared without giving them access to your HubSpot account.
For marketing teams, that combination makes a few conversations significantly easier:
Defending lead quality, not just lead volume: the Lead rate and the Lifecycle Stage Pareto chart lets you show, for example, if the same period produced a higher proportion of MQLs and SQLs, or if volume went up while quality held flat, which is a different conversation worth having.
Identifying which sources are actually working: The Original Source Pareto makes it easy to see that Organic Search drives 50% of the contacts, while Paid Social drives 7%, without having to explain what a Pareto chart is. The cumulative line does it.
Spotting outreach gaps before they become pipeline gaps: A large “Attempted to Contact” cohort relative to “Connected” shows up immediately in the status breakdown chart. That’s not a number you’d typically see at a glance in HubSpot’s native contact list.
Keeping every device on the same page: Because there is no Power Query, it works the same for Windows users and Mac users on the same team.
If your team is reporting on the inbound leads from a mix of tabs, exports, and manually updated pivot tables, this is a faster starting point. Download the HubSpot Inbound Leads Dashboard Template and connect it to your own data.
FAQ
A pull of your HubSpot Contacts, including: First Name, Last Name, Company Name, Lead Status, Lifecycle Stage, Close Date, Create Date, Original Source, and Latest Traffic Source. All are standard HubSpot fields, no custom properties required.
Yes. It’s built entirely on plain formulas reading from an ExtendInsights pull tab, with no Power Query, macros, or external connections, so it behaves the same way on Mac and Windows.
Lead Rate is Total Leads divided by Total Contacts, expressed as a percentage. It measures what proportion of your contacts in a given period reached the Lead lifecycle stage. A rising lead rate signals improving contact quality or more effective qualification; a flat or falling rate while volume grows can signal the opposite.
It ranks your contact sources from highest to lowest volume and overlays a cumulative percentage line. The cumulative line makes the 80/20 breakdown immediately visible. Typically, two or three sources account for 80% or more of contacts, and the Pareto view identifies them in one glance. AI referrals appear as a source category for contacts coming through AI-based channels, alongside Organic Search, Paid Search, Referrals, and others.
Use the Lead Status dropdown on the Leads Dashboard tab. The dropdown is populated automatically from the statuses present in your data, so it stays current without manual maintenance. Combined with the From and To date filters, it narrows every KPI and chart on the dashboard simultaneously.
The HubSpot API caps filtered downloads at 10,000 records. This is a HubSpot limit, not an ExtendInsights one. The workaround is to remove any filter in the ExtendInsights task pane and download the full dataset, then use the dashboard’s own date range and status filters to narrow the view to the period that you care about.
Yes. It is a free, downloadable ExtendInsights template. You’ll need an ExtendInsights subscription to pull your live HubSpot data into it, but the template itself is free, and ExtendInsights pricing is fixed regardless of how often you refresh or how many contacts you pull.
Original Source is the channel that first brought the contact into HubSpot. It is the acquisition channel. Latest Traffic Source is the most recent channel that drove a session for that contact. The dashboard uses Original Source for its source analysis charts, so the Pareto view reflects acquisition credit. Latest Traffic Source is included in the data model and is available in the underlying Leads Calcs tab if your team wants to build a last-touch comparison alongside it.